

AI CERTS
2 hours ago
SVLAT: Scientific Visualization Benchmark for Literacy Testing
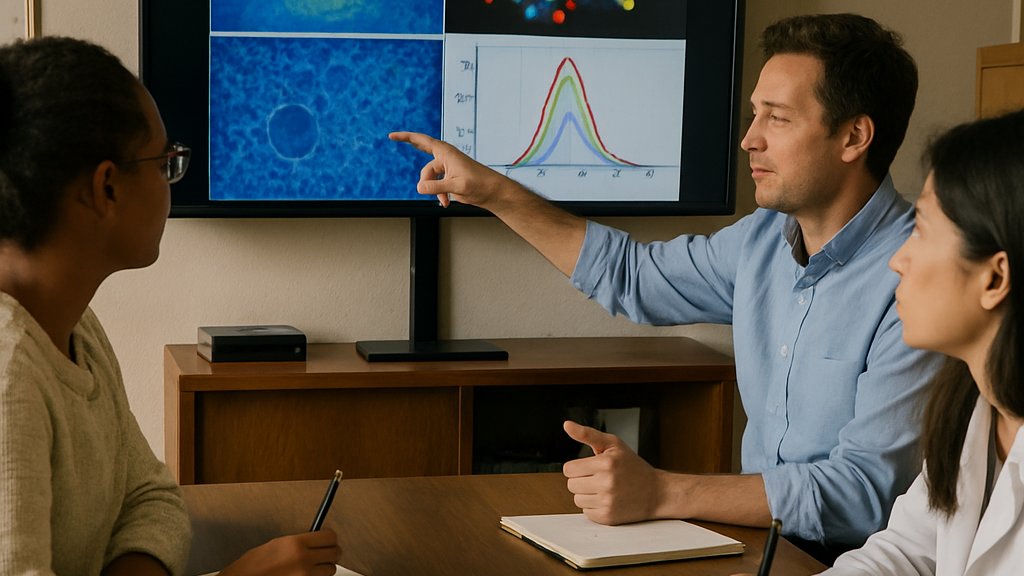
Along the way, we contrast it with prior multimodal benchmarks and highlight emerging VLM evaluation needs. We also point to certifications that strengthen visualization understanding careers. Ultimately, readers will grasp why this Scientific Visualization Benchmark matters now.
Why New Benchmark Matters
Historically, visualization literacy tests targeted bar charts and dashboards. Consequently, scientific visualizations such as volume renders lacked dedicated assessment tools. The new test responds by framing a Scientific Visualization Benchmark devoted to spatial and physical data.
Moreover, researchers needed an open, psychometrically grounded scale for cross study comparison. SVLAT fills that vacuum with transparent item banks and reproducible scripts. Consequently, replication becomes feasible across institutions, demographics, and multimodal benchmarks.
Policy makers also gain a reliable baseline for assessing national chart literacy programs. Meanwhile, AI teams view the benchmark as fresh ground truth for visualization understanding evaluation. These factors demonstrate real demand.
Academic funding bodies already cite the benchmark when outlining reproducibility guidelines. Additionally, journal reviewers can reference standardized scores rather than anecdotal claims.
SVLAT satisfies gaps left by VLAT and Mini-VLAT. It anchors the evolving Scientific Visualization Benchmark landscape. Next, we unpack the psychometrics driving that credibility.
Psychometrics Behind The Test
Designers followed a rigorous Classical Test Theory pipeline. Firstly, five SciVis experts rated candidate items, producing a Content Validity Ratio of 0.79 for research QA. Subsequently, a pilot with 30 participants refined wording and timing.
The large tryout involved 485 respondents spanning varied educational backgrounds. Consequently, item difficulty and discrimination estimates stabilized. Bayesian two-parameter IRT then modeled latent ability while McDonald’s omega reached 0.82. Cronbach’s alpha echoed this reliability at 0.81. Therefore, the Scientific Visualization Benchmark reports consistent scores across mid-range abilities.
Nevertheless, measurement precision drops at extreme proficiency levels. In contrast, InfoVis tools often show similar limitations, suggesting a tradeoff between length and breadth. These psychometric insights equip educators planning adaptive versions. Future item calibration studies may exploit computerized adaptive testing to sharpen endpoints.
Overall, SVLAT offers robust internal consistency. Its transparent modeling strengthens confidence in the Scientific Visualization Benchmark. The next section translates these numbers into concrete findings.
Key Findings And Stats
SVLAT covers eight visualization techniques and eleven task types. Moreover, items span volume rendering, flow visualization, isosurfaces, and medical imaging. Such breadth fosters deeper visualization understanding across domains.
Highlights include:
- Average participant score: 26.4 / 49 (SD 7.1).
- Item discrimination median: 0.38 under IRT.
- Test information peaking near ability theta 0.
- Open materials released under CC BY-NC-SA 4.0.
- Discriminatory power exceeded 0.4 for 35% of items.
Consequently, researchers can focus sampling on middle ability groups where measurement is sharpest. Meanwhile, AI teams note which visual encodings challenge models the most. Color based distinctions and precise value extraction remain stumbling blocks in current VLM evaluation studies. Therefore, engineering domains can map ability theta to prerequisite course modules.
SVLAT’s statistics reveal where human comprehension falters. They equally expose tasks ripe for Scientific Visualization Benchmark driven model testing. Those implications become clearer when shifting to AI performance.
Implications For AI Evaluation
Large multimodal models promise chart reasoning yet struggle with complex scalar fields. Recent research QA experiments show mixed outcomes. Moreover, trend detection succeeds while color mapping confuses even state of the art transformers.
SVLAT therefore provides a domain specific Scientific Visualization Benchmark for measurable progress. Multimodal benchmarks can embed selected items to compare architectures fairly. Additionally, granular item metadata help isolate failure modes during VLM evaluation pipelines. Meanwhile, research QA protocols can align failure explanations with human misconceptions.
In contrast, prior datasets like ChartQA lack volumetric phenomena. Consequently, researchers adopting SVLAT gain richer test coverage for visualization understanding. These advantages should accelerate trustworthy AI deployment.
AI teams finally access psychometrically vetted stimuli. Such assets raise the bar for future Scientific Visualization Benchmark competitions. Education stakeholders also benefit, as discussed next.
Opportunities In SciVis Education
Educators face widening skill gaps in chart literacy across engineering programs. SVLAT’s item bank enables formative quizzes aligned with lecture content. Furthermore, adaptive delivery can prioritize misunderstood volumetric cues.
Students also practice research QA by critiquing misleading encoding choices. Moreover, the open license permits translation for international classrooms. Professionals can enhance their expertise with the AI+ UX Designer™ certification.
Institutions may use pre- and post-course tests to measure gains objectively. Consequently, curriculum iterations gain immediate feedback backed by a Scientific Visualization Benchmark. Instructors can correlate pre-test scores with lab performance to personalize tutoring.
SVLAT bridges classroom instruction and empirical evaluation. Its flexibility prepares learners for complex multimodal benchmarks in industry. Future adoption research will test that promise.
Future Research And Adoption
SVLAT remains a preprint awaiting peer review at IEEE VIS. Subsequently, cross cultural validation will broaden generalizability. Moreover, shorter adaptive versions could reduce administration time.
Researchers plan to link SVLAT scores with cognitive load and eye tracking. Additionally, longitudinal studies may reveal how chart literacy develops over careers. Industry consortia might launch annual challenges using the Scientific Visualization Benchmark as ground truth. Moreover, VLM evaluation leaders propose integrating SVLAT into yearly Large Model bakeoffs.
Nevertheless, limitations persist, especially precision at ability extremes. Consequently, complementary diagnostics could address those tails.
Community engagement will refine SVLAT iteratively. Robust adoption will cement its role as the definitive Scientific Visualization Benchmark. The final section recaps essential insights.
Conclusion And Next Steps
SVLAT establishes a timely benchmark for human and machine assessment. Its psychometric foundation, open materials, and domain coverage outperform many multimodal benchmarks. Moreover, detailed metadata accelerates rigorous VLM evaluation and fuels deeper visualization understanding research.
Educators can integrate items directly, while certifications like the AI+ UX Designer™ boost professional credibility. Consequently, adopting SVLAT delivers measurable chart literacy gains across sectors.
Multimodal benchmarks thrive when grounded in reliable human data, and SVLAT supplies that foundation. Consequently, stakeholders should pilot the test and share outcomes with the broader community. Join the community, explore the repository, and leverage this standard to elevate your next project.
Disclaimer: Some content may be AI-generated or assisted and is provided ‘as is’ for informational purposes only, without warranties of accuracy or completeness, and does not imply endorsement or affiliation.


